

Composition
Holdings
Distributions
Ex-Date/Pay Date/Reinvest Date: 12/30/2025
Ordinary Income: $0.02786151
Short Term Capital Gains: $0.00053
Long Term Capital Gains: $2.07724
Total Distributions Per Share: $2.10563151
Any tax or legal information provided is merely a summary of our understanding and interpretation of some of the current income tax regulations and it is not exhaustive. Investors must consult their tax advisor or legal counsel for advice and information concerning their particular situation. Neither the Funds nor any of its representatives may give legal or tax advice.
Top 10 Holdings
as of December 31, 2025 per Advent APX
| Security | % Portfolio |
|---|---|
| Alphabet Inc | 9.5% |
| Nvidia Corp | 9.1% |
| Microsoft Corp | 5.9% |
| Apple Inc | 5.1% |
| Morgan Stanley | 5.0% |
| Amazon.Com Inc | 4.6% |
| Jp Morgan Chase & Co | 4.3% |
| Comfort Systems Usa Inc | 4.3% |
| Mastercard Inc Cl A | 4.2% |
| Viking Holdings Ltd | 3.9% |
Fund holdings and sector allocations are subject to change at any time and should not be considered recommendations to buy or sell any security.
Portfolio Characteristics
as of December 31, 2025 per Factset
| EWMCX | S&P 500 TR | |
|---|---|---|
| Forward Price/Earnings | 25.5x | 21.1x |
| EPS Growth 1 yr. | 10.0% | 8.5% |
| Return on Average Invested Capital | 18.1% | 9.7% |
| Return on Equity | 31.8% | 15.7% |
| Debt/Cap | 31.3% | 39.0% |
| Active Share* | 66.5% | |
*per Morningstar.
VIEW PORTFOLIO CHARACTERISTICS DEFINITIONS
Forward Price/Earnings Measure of the price-to-earnings ratio (P/E) using forecasted earnings for the P/E calculation.
EPS Growth Represents the annualized rate of net-income-per-share growth over the trailing one-year period for the stocks held by a fund.
Return on Average Invested Capital is calculated as last twelve months divided by the two fiscal period average of Total Invested Capital, multiplied by 100.
Return on Equity Amount of net income returned as a percentage of shareholders equity.
Debt/Cap Measurement of a company’s financial leverage, calculated as the company’s debt divided by its total capital.
Active Share The percentage of fund holdings that is different from the benchmark holdings. As a result, the Active Share for a particular fund will differ depending on which benchmark is used. Active Share is calculated as 100% minus the sum of the overlapping portfolio weights, where the overlapping portfolio weights only pertain to stocks that are in both the fund and the benchmark with a long position.
Earnings growth is not a measure of the Fund’s future performance.
Portfolio Construction: Large, medium and small capitalization stocks are selected based on an analysis of a company’s prospects, returns, past and expected future performance and the quality of corporate management and capital allocation. We focus on companies that are experiencing positive fundamental and sustainable changes that should benefit investors.
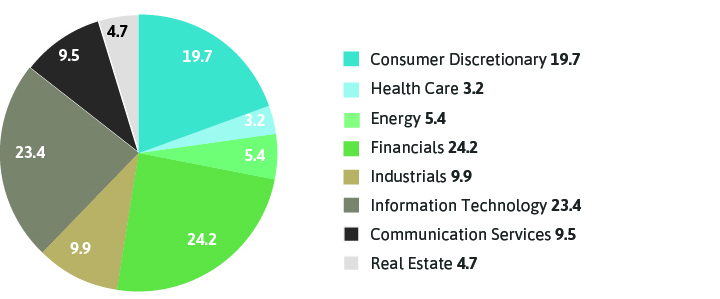
Sector Allocation %
as of December 31, 2025 per Advent APX
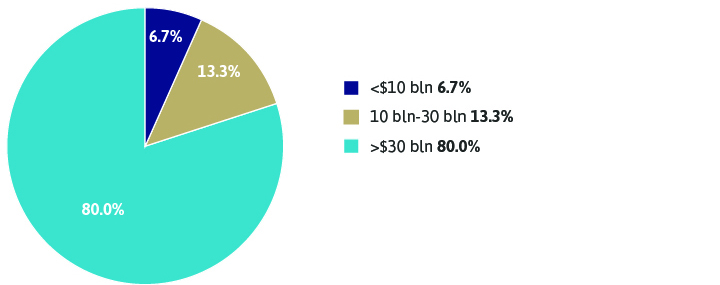
Market Cap of Companies in the Portfolio
as of December 31, 2025 per Advent APX
DISCLOSURES
Mutual Fund Investing involves risk. Principal loss is possible. The Fund may invest in foreign securities which involve political, economic and currency risks, greater volatility and differences in accounting methods.
The Evercore Equity Fund may invest in smaller companies, which involves additional risks such as limited liquidity and greater volatility than large capitalization companies.
Diversification does not assure a profit or protect against loss in a declining market.
The fund’s investment objectives, risks, charges, and expenses must be considered carefully before investing. The prospectus contains this and other information about the investment company and can be obtained by clicking this link or a free hard-copy is available by calling (800) 443-4693. Read it carefully before investing.
The fund is offered only to United States residents, and information on this site is intended only for such persons. Nothing on this website should be considered a solicitation to buy or an offer to sell shares of the fund in any jurisdiction where the offer or solicitation would be unlawful under the securities laws of such jurisdiction.
Any tax or legal information provided is not an exhaustive interpretation of some of the current income tax regulations. Investors must consult their tax advisor or legal counsel for advice and information concerning their particular situation. Neither the Fund nor any of its representatives may give legal or tax advice.